
Introduction
Temperature does not drop steadily as you climb through the atmosphere — it rises, falls, and reverses in patterns that govern everything from storm formation to aerospace vehicle performance. Understanding how temperature varies with altitude is foundational to atmospheric science, and the consequences of getting it wrong ripple across weather forecasting, acoustic propagation, payload heating, and drag modeling.
For systems like Green Launch's hydrogen light-gas propulsion technology — which accelerates payloads to Mach 9 velocities through a single-stage ground-based impulse — these temperature variations translate into drag losses, thermal loading, and acoustic shadow zones that must be accurately predicted for range safety compliance.
This guide breaks down what the vertical temperature profile is, how it behaves across each atmospheric layer, how it is measured, and why precision in this data matters for launch system planning and aerospace applications.
Key Takeaways
- The vertical atmospheric temperature profile records air temperature continuously from the surface through the troposphere, stratosphere, mesosphere, and thermosphere
- Temperature alternates between decreasing and increasing across each successive atmospheric layer
- The lapse rate determines atmospheric stability and whether rising air parcels accelerate or suppress vertical motion
- Temperature inversions are critical boundaries affecting convection, acoustic propagation, and vehicle trajectory planning
- Profiles are measured via radiosondes, ground-based radiometers, and satellite sounders
What a Vertical Temperature Profile Represents in Atmospheric Science
A vertical temperature profile is a dataset or graphical record showing air temperature as a continuous function of altitude (or pressure level), typically from Earth's surface up to the lower thermosphere (~80–100 km). It characterizes atmospheric state at a specific location and time — the environmental input that determines what any vertically moving object (air parcel, projectile, rocket, or balloon) will thermally and dynamically encounter as it ascends.
In atmospheric systems and engineering models, the profile is a measured environmental constraint — not something operators control, but something they must account for. According to the ICAO Standard Atmosphere documentation, the International Standard Atmosphere (ISA) provides reference tables and constants for design, testing, and instrument calibration, but it is explicitly not intended for real-time forecasting or site-specific mission planning.
The ISA assumes a sea-level temperature of 15°C and a uniform lapse rate of 6.5°C/km up to 11 km — a statistical average designed for aircraft performance baselines, not operational conditions.
A real-time sounding profile reflects actual local, seasonal, and synoptic conditions. For launch operators, treating an ISA baseline as a substitute for a same-day sounding is an engineering error with real operational consequences.
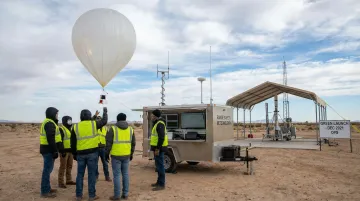
Green Launch addresses this directly by conducting fresh meteorological balloon soundings on launch day. During their December 2021 vertical launch at Yuma Proving Ground, the team released a telemetry-equipped balloon to measure winds aloft — confirming the projectile would remain within the test range across its three-minute flight to 30 km altitude.
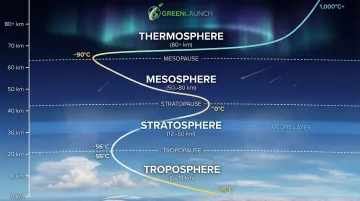
Atmospheric Layers and Their Temperature Ranges
The atmosphere is stratified into thermally distinct layers defined by the direction of temperature change with altitude. These boundaries—the tropopause, stratopause, and mesopause—represent critical transitions in density, composition, and thermal behavior relevant to any system traversing them.
Troposphere
The troposphere is the lowest atmospheric layer, extending from the surface to approximately 8–9 km at the poles and 16–18 km at the tropics. The tropopause altitude varies with latitude, from ~8–12 km in the extratropics to 15 km or higher in tropical regions. Temperature decreases with altitude at an average rate of ~6.5°C/km, dropping from a global average surface temperature near 15°C to roughly −56°C at the tropopause. Nearly all weather and most aerospace operations take place within this layer, making it the most operationally significant for ground-based launch systems.
For Green Launch's impulse-accelerated payloads exiting the launch tube at Mach 3+ velocities, the troposphere presents the highest aerodynamic drag and convective heating environment. The sharp density gradient at the tropopause creates a transition zone that must be accounted for in trajectory models for any vehicle accelerating through the lower 50 km.
Tropopause and Stratosphere
The tropopause is the isothermal or slightly inverted boundary capping the troposphere, marking the coldest temperature encountered in the lower atmosphere. Above it, the stratosphere (roughly 12–50 km) exhibits a temperature reversal—rising from the tropopause minimum back toward approximately 0°C at the stratopause—due to ozone absorption of solar ultraviolet radiation. This inversion layer acts as a strong stability cap suppressing convective overshoot.
That same thermal structure also governs acoustic propagation. The stratospheric inversion acts as a waveguide: low-frequency overpressure from ground-based impulse accelerators can be ducted along the inversion layer, focusing blast energy tens of kilometers from the launch site.
Mesosphere and Mesopause
The mesosphere (50–80 km) is the layer where temperature again decreases with altitude, reaching the mesopause—the absolute coldest point in the entire atmosphere. Research indicates the mesopause temperature reaches approximately −85 to −90°C, making it the coldest location in Earth's atmospheric system. This layer is where noctilucent clouds form and where re-entering or ascending objects at hypersonic speeds begin to encounter severe aerodynamic heating despite low air density.
Ambient temperature here is almost irrelevant to projectile heating. At Mach 9, the kinetic energy of an impulse-launched payload generates aerothermal stagnation heating that can drive surface temperatures above 1,000°C—entirely independent of the −90°C surrounding air.
Thermosphere
Above ~80 km, temperature rises dramatically in the thermosphere due to absorption of extreme ultraviolet radiation, with kinetic temperatures technically exceeding 1,000°C at solar maximum. However, as documented in the US Standard Atmosphere 1976, the particle density is so low that conventional heat transfer does not occur. These temperatures reflect molecular kinetic energy, not bulk heat transfer—meaning payload thermal protection systems must be sized against aerodynamic heating during ascent, not thermospheric ambient conditions.
Lapse Rate, Temperature Inversions, and Atmospheric Stability
The lapse rate—the rate at which temperature changes with altitude—is the governing parameter for whether the atmosphere will amplify or suppress vertical air motion. Comparing the environmental lapse rate to the adiabatic lapse rates of rising air parcels determines stability classification.
Dry and Moist Adiabatic Lapse Rates
The Dry Adiabatic Lapse Rate (DALR) is approximately 9.8°C/km, the rate at which an unsaturated air parcel cools as it rises, driven by pressure decrease. The Saturated Adiabatic Lapse Rate (SALR), also called the Moist Adiabatic Lapse Rate (MALR), is approximately 5–6°C/km, lower because condensation releases latent heat that partially offsets the cooling.
The gap between DALR and MALR defines the conditionally unstable regime: a common atmospheric state in summer where the environment is stable for dry parcels but unstable for saturated ones, responsible for deep convective development.
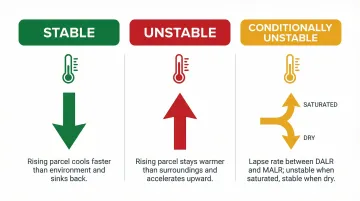
Atmospheric Stability Classifications
Three stability regimes govern vertical air motion:
- Stable: Environmental lapse rate less than DALR—rising parcel becomes cooler than surroundings and sinks back
- Unstable: Environmental lapse rate exceeds DALR—rising parcel remains warmer and accelerates upward
- Conditionally unstable: Environmental lapse rate falls between DALR and MALR—stable for dry parcels, unstable for saturated ones
Temperature Inversions
A temperature inversion is any layer in which temperature increases with altitude rather than decreasing, the opposite of the normal lapse rate. Major types include:
- Surface radiation inversions: Nighttime cooling of the ground surface
- Subsidence inversions: Descending air in high-pressure systems warms adiabatically
- Stratospheric inversion: Caused by ozone absorption of UV radiation
Inversions act as hard lids on convective motion, trap pollutants, and create acoustic ducting anomalies affecting long-range sound propagation. Atmospheric inversions, particularly subsidence inversions, are a primary cause of acoustic ducting: the inversion layer bends sound back toward the surface, focusing acoustic energy and severely distorting signals from impulsive sources at long range.
For launch operations, this matters directly. High-velocity systems generate substantial acoustic energy, and accurate vertical profiles let mission planners predict where that energy concentrates. Green Launch's light-gas propulsion systems, for example, rely on pre-launch atmospheric soundings to identify inversion layers that could focus blast energy toward populated areas or sensitive infrastructure — a core component of range safety planning.
Convective Parameters: LCL, LFC, and CAPE
Three derived parameters connect the temperature profile to convective behavior:
- Lifting Condensation Level (LCL): The altitude where a rising parcel cools to its dew point and condensation begins, marking the base of convective clouds
- Level of Free Convection (LFC): The level above the LCL where the parcel becomes positively buoyant and convection accelerates without external forcing
- Convective Available Potential Energy (CAPE): The total energy available for convective acceleration, measured as the area between the parcel's ascent path and the environmental temperature curve on a thermodynamic diagram
The NWS Storm Prediction Center defines four operational CAPE thresholds:
| Instability Level | CAPE Range |
|---|---|
| Weak | < 1,000 J/kg |
| Moderate | 1,000–2,500 J/kg |
| Strong | 2,500–4,000 J/kg |
| Extreme | > 4,000 J/kg |
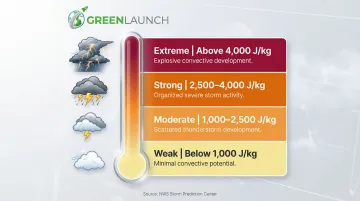
For launch planning, extreme CAPE values (> 4,000 J/kg) indicate conditions where convective development is likely — but the highest-risk scenario combines elevated CAPE with a subsidence inversion. The inversion suppresses convection until enough energy builds to break through, at which point storms can develop explosively and with little warning.
How Vertical Temperature Profiles Are Measured and Validated
Temperature profiles are both a scientific dataset and an engineering input. The method of measurement determines spatial resolution, temporal frequency, and accuracy—all of which affect how reliably the data can be applied to mission planning.
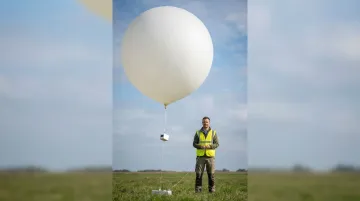
Radiosondes and Weather Balloons
The radiosonde is the primary in-situ measurement tool for upper-air data: a lightweight instrument package carried by a hydrogen- or helium-filled balloon, transmitting real-time temperature, pressure, and humidity back to the surface station as it ascends. The global WMO network operates approximately 1,300 upper-air stations, with observations taken at standard synoptic times of 00Z and 12Z UTC.
The skew-T log-P diagram is the standard format for displaying radiosonde output, plotting temperature and dew point across the full troposphere and lower stratosphere.
For operational launch planning, this methodology matters directly. Green Launch releases meteorological balloons on launch day to capture real-time atmospheric conditions rather than relying on archived forecasts or standardized models.
Ground-Based and Satellite Remote Sensing
Ground-based systems augment balloon data by providing higher-frequency, continuous monitoring without consumable hardware:
- Microwave radiometers: Provide continuous time-series measurements of brightness temperatures, retrieving vertical profiles of temperature, humidity, and cloud liquid water content
- Raman lidars: Deliver high-resolution vertical profiling of moisture and aerosol extinction
- Wind profilers: Track wind speed and direction at multiple altitude levels
Satellite-based sounders infer temperature profiles by measuring thermally emitted radiation at multiple frequencies—different frequencies penetrating to different altitudes based on atmospheric absorption characteristics. Advanced instruments like CrIS provide 2,211 spectral channels, while IASI offers 8,461 channels for ultra-high resolution atmospheric profiling. These platforms fill the spatial and temporal gaps between balloon launches, though their vertical resolution remains coarser than direct in-situ measurements—an important tradeoff when precision at a specific launch site is required.
Why Vertical Temperature Profiles Matter for Aerospace Applications
Temperature governs air density and viscosity—both of which directly affect aerodynamic drag, dynamic pressure, and structural loads on any ascending vehicle. The sharp density gradient at the tropopause and the warming inversion in the stratosphere create a transition zone that must be accounted for in trajectory models for any vehicle accelerating through the lower 50 km.
Temperature inversions also affect acoustic propagation in ways critical for surface-launched systems. High-velocity gas-propelled launchers must account for inversion-layer ducting when modeling ground-level overpressure and muzzle-blast propagation.
Accurate vertical profiles let mission planners predict acoustic shadow zones and confirm range safety compliance. Acoustic waves can refract back toward the surface, focusing energy tens of kilometers from the launch site—a hazard that standard atmosphere models cannot predict.
That principle extends directly to high-velocity launch systems. Green Launch's light-gas propulsion accelerates payloads to Mach 9 velocities from the ground, minimizing atmospheric drag before a secondary engine provides the remaining velocity for orbital insertion. For unguided vehicles moving at that speed, a same-day radiosonde sounding delivers measurably better trajectory fidelity than any static atmosphere assumption:
- Density errors compound across altitude layers, widening downrange dispersion
- Wind shear gradients near the tropopause shift ballistic trajectories unpredictably
- Temperature inversions alter dynamic pressure at critical acceleration phases
Green Launch's December 2021 vertical launch demonstrated this principle operationally: a 28-pound projectile reached 30 km altitude with ground-based acceleration to Mach 3+, traversing the troposphere and entering the stratosphere in approximately three minutes. The meteorological balloon launched simultaneously provided real-time wind and atmospheric data to ensure the unguided projectile would not drift off-range—a direct application of atmospheric profiling to mission safety.
Common Misinterpretations of Atmospheric Temperature Data
Treating the International Standard Atmosphere (ISA) model as a substitute for real-time sounding data introduces severe dispersion errors. The ISA is a statistical average designed for aircraft performance calculation, not for predicting actual profile conditions on a given day or at a specific geographic location. Launch operators relying on ISA for day-of-launch trajectory modeling face serious deviations due to actual density and wind shear variations.
A second common error is conflating temperature inversion with general atmospheric warming, or treating the tropopause as a fixed altitude. In reality, tropopause height varies by more than 8 km between polar and equatorial regions and shifts with the seasons. Launch planners must use location- and season-specific profiles rather than global averages—the density gradient transition occurs at vastly different flight times depending on latitude.
Frequently Asked Questions
How are vertical temperature profiles of the atmosphere obtained?
The primary method is radiosonde balloon ascent, which measures temperature, pressure, and humidity in situ as the balloon rises. Ground-based microwave radiometers and satellite-based infrared/microwave sounders supplement this by inferring profiles remotely using atmospheric emission at multiple frequencies.
What is the vertical temperature profile of the atmosphere?
It is a continuous record of air temperature as a function of altitude from the surface to the upper atmosphere, showing how temperature decreases in the troposphere, increases in the stratosphere, decreases again in the mesosphere, and climbs steeply in the thermosphere.
What are the vertical layers of the atmosphere based on temperature?
The four thermally defined layers are the troposphere (temperature decreasing), stratosphere (increasing), mesosphere (decreasing), and thermosphere (sharply increasing). Each is separated by a boundary called a "pause"—tropopause, stratopause, and mesopause.
Which boundary in the atmosphere has the lowest temperature?
The mesopause (~80 km altitude) is the coldest point in the atmosphere, with temperatures reaching approximately −85 to −90°C. At this altitude, solar radiation is too attenuated to warm the air and heat from below has diminished.
What is LCL in the atmosphere?
The Lifting Condensation Level is the altitude at which a rising unsaturated air parcel cools to its dew point temperature and condensation begins. It marks the base of convective clouds and is derived from the parcel's surface temperature and moisture content.
What is the process of vertical heating of the atmosphere?
Each atmospheric layer has a distinct heat source. The surface absorbs solar radiation and re-emits longwave heat, warming the troposphere from below. Ozone drives stratospheric heating by absorbing UV radiation, while extreme UV and X-ray absorption heats the thermosphere — explaining the temperature reversals at each layer boundary.